

Using Times Square for observatory reporting#
Abstract
Times Square is a SQuaRE service that supports parametrized non-interactive notebook execution. Although primarily developed for other purposes, it has the potential to be of use in generating periodic (eg nightly) observing reports. This technote describes the capabilities of this toolchain, advantages and limitations of this approach, and future development that if prioritized, could address some of those limitations.
Times Square overview#
Times Square (SQR-062) is a service that leverages Noteburst (SQR-065) that provides, inter alia, a front-end to driving and displaying the execution of parametrized nublado (RSP) notebooks. This toolchain was initially developed as a prototype for an RSP notebook batch execution service with an eye for using it as a basis for “live” documentation.
Let’s say you have written an RSP notebook that looks at last night’s data to calculate and graph seeing as a function of telescope elevation. This notebook can be turned into a Times Square payload notebook with the date of observation as the declared parameter. This means that you can ask Times Square to show you the output of this notebook (with or without the code cells) for any night whose date you specify in the Times Square UI. The results of this execution can be cached so that if you (or someone else) wants to see that again, there is no delay (or computational cost) for you to see the graph again. In that respect, Times Square draws its name from the NYC area known for its billboards: while their content can be easily updated, it is also there for all to see in the meanwhile.
Can Times Square be used for night reports?#
Time Square’s features supporting periodic reporting mean that it is a tool that may be of use to other forms of periodic reporting, and in this technote we discuss its application for what is often called end-of-night observing log summaries, which we will here call night reports. Of course, due to the parametrization, the time is irrelevant (it could be weekly reports, or while I was on vacation reports), however night reports are a known essential observatory function so we will focus on discussing that usecase.
Advantages of using Times Square for night reports include:
RSP/Jupyter Notebook payload is familiar and in common use among operations staff, making it easier to crowdsource improvements
Easy to iterate payload development in the RSP before “promoting” it to Times Square.
Different teams can easily develop different night reports for different areas of interest (telescope performance, survey statistics etc)
The option to see code cells or not in the UI means that both technical and non-technical audiences can be satisfied
Caching execution means reduced load on data sources when everybody wants to look at the report in the morning
Dynamic execution means incremental improvements to the notebook payload is retroactively available for older dates (for example if you add a new plot to the “night report” notebook, you can run it on an observing night from a year ago and see the plot)
Self-service through gitops deployment model does not require SQuaRE involvement nor service interruption for payload updates
Extant toolchain fulfils a number of functions of a night report system and can be used right away
Current limitations that could be addressed if Times Square was adopted by the observatory for this purpose:
Data sources required by the payloads need to be available through an API, and authentication and/or VPN barriers need to be addressed (see SQR-083 for further on this issue)
Summit load is a concern and hence we heavily recommend Times Square runs at USDF - however this means that if people want a “night report so far” halfway through the night all relevant data sources need to be current at USDF
Current payload may be incompatible with past observing data APIs. This can be addressed by adding to Times Square the ability to optionally persist its cache as an artifact (static HTML, PDF, TBD) so that a report be snapshot for archival purposes.
While the interactive capabilities of rendered notebooks are very limited, integration with the RSP could be on the roadmap if the RSP can provide certain capabilities (eg click here to open this image in the RSP portal)
Limitations that are inherent in this model and cannot be addressed:
This is never going to be equivalent to a fully captive interactive web application dedicated to this purpose, and some of the desires we have heard expressed for night reporting can only be met by an app like that.
Yes, more production code based on Jupyter Notebooks, which many are not a fan of. Some discipline will be required to make sure substantial computation is pushed to python modules and/or performed in services “upstream” of the night report notebooks.
Yet another DM/SQuaRE service that is involved in daily operations that deflects focus from external science users and would have to be added to the support load of the Summit Support team proposed (but not as yet adopted) in RTN-069
The question for the project is whether the immediate availability of the Times Square capabilities (ie getting substantial but not everything one could think of functionality “for free”) outweigh the inherent limitations in this model.
Examples#
We’ve prepared examples of notebooks featuring the kinds of information that might be commonly included in an observatory report. These demos are available in the lsst-sqre/times-square-usdf GitHub repository and are published on the “dev” RSP environment at the USDF, which is accessible with SLAC credentials.
Jira issue summary#
Times Square notebooks can query Rubin’s Jira API and generate a summary of issues. The “OBS issues” notebook queries for issues in the OBS Jira Project within a parameterized date range and uses Pandas to generate an HTML table of the issues. On a technical level, this notebook also demonstrates a solution for accessing data APIs that require authentication by way of a proxy service (see SQR-083).
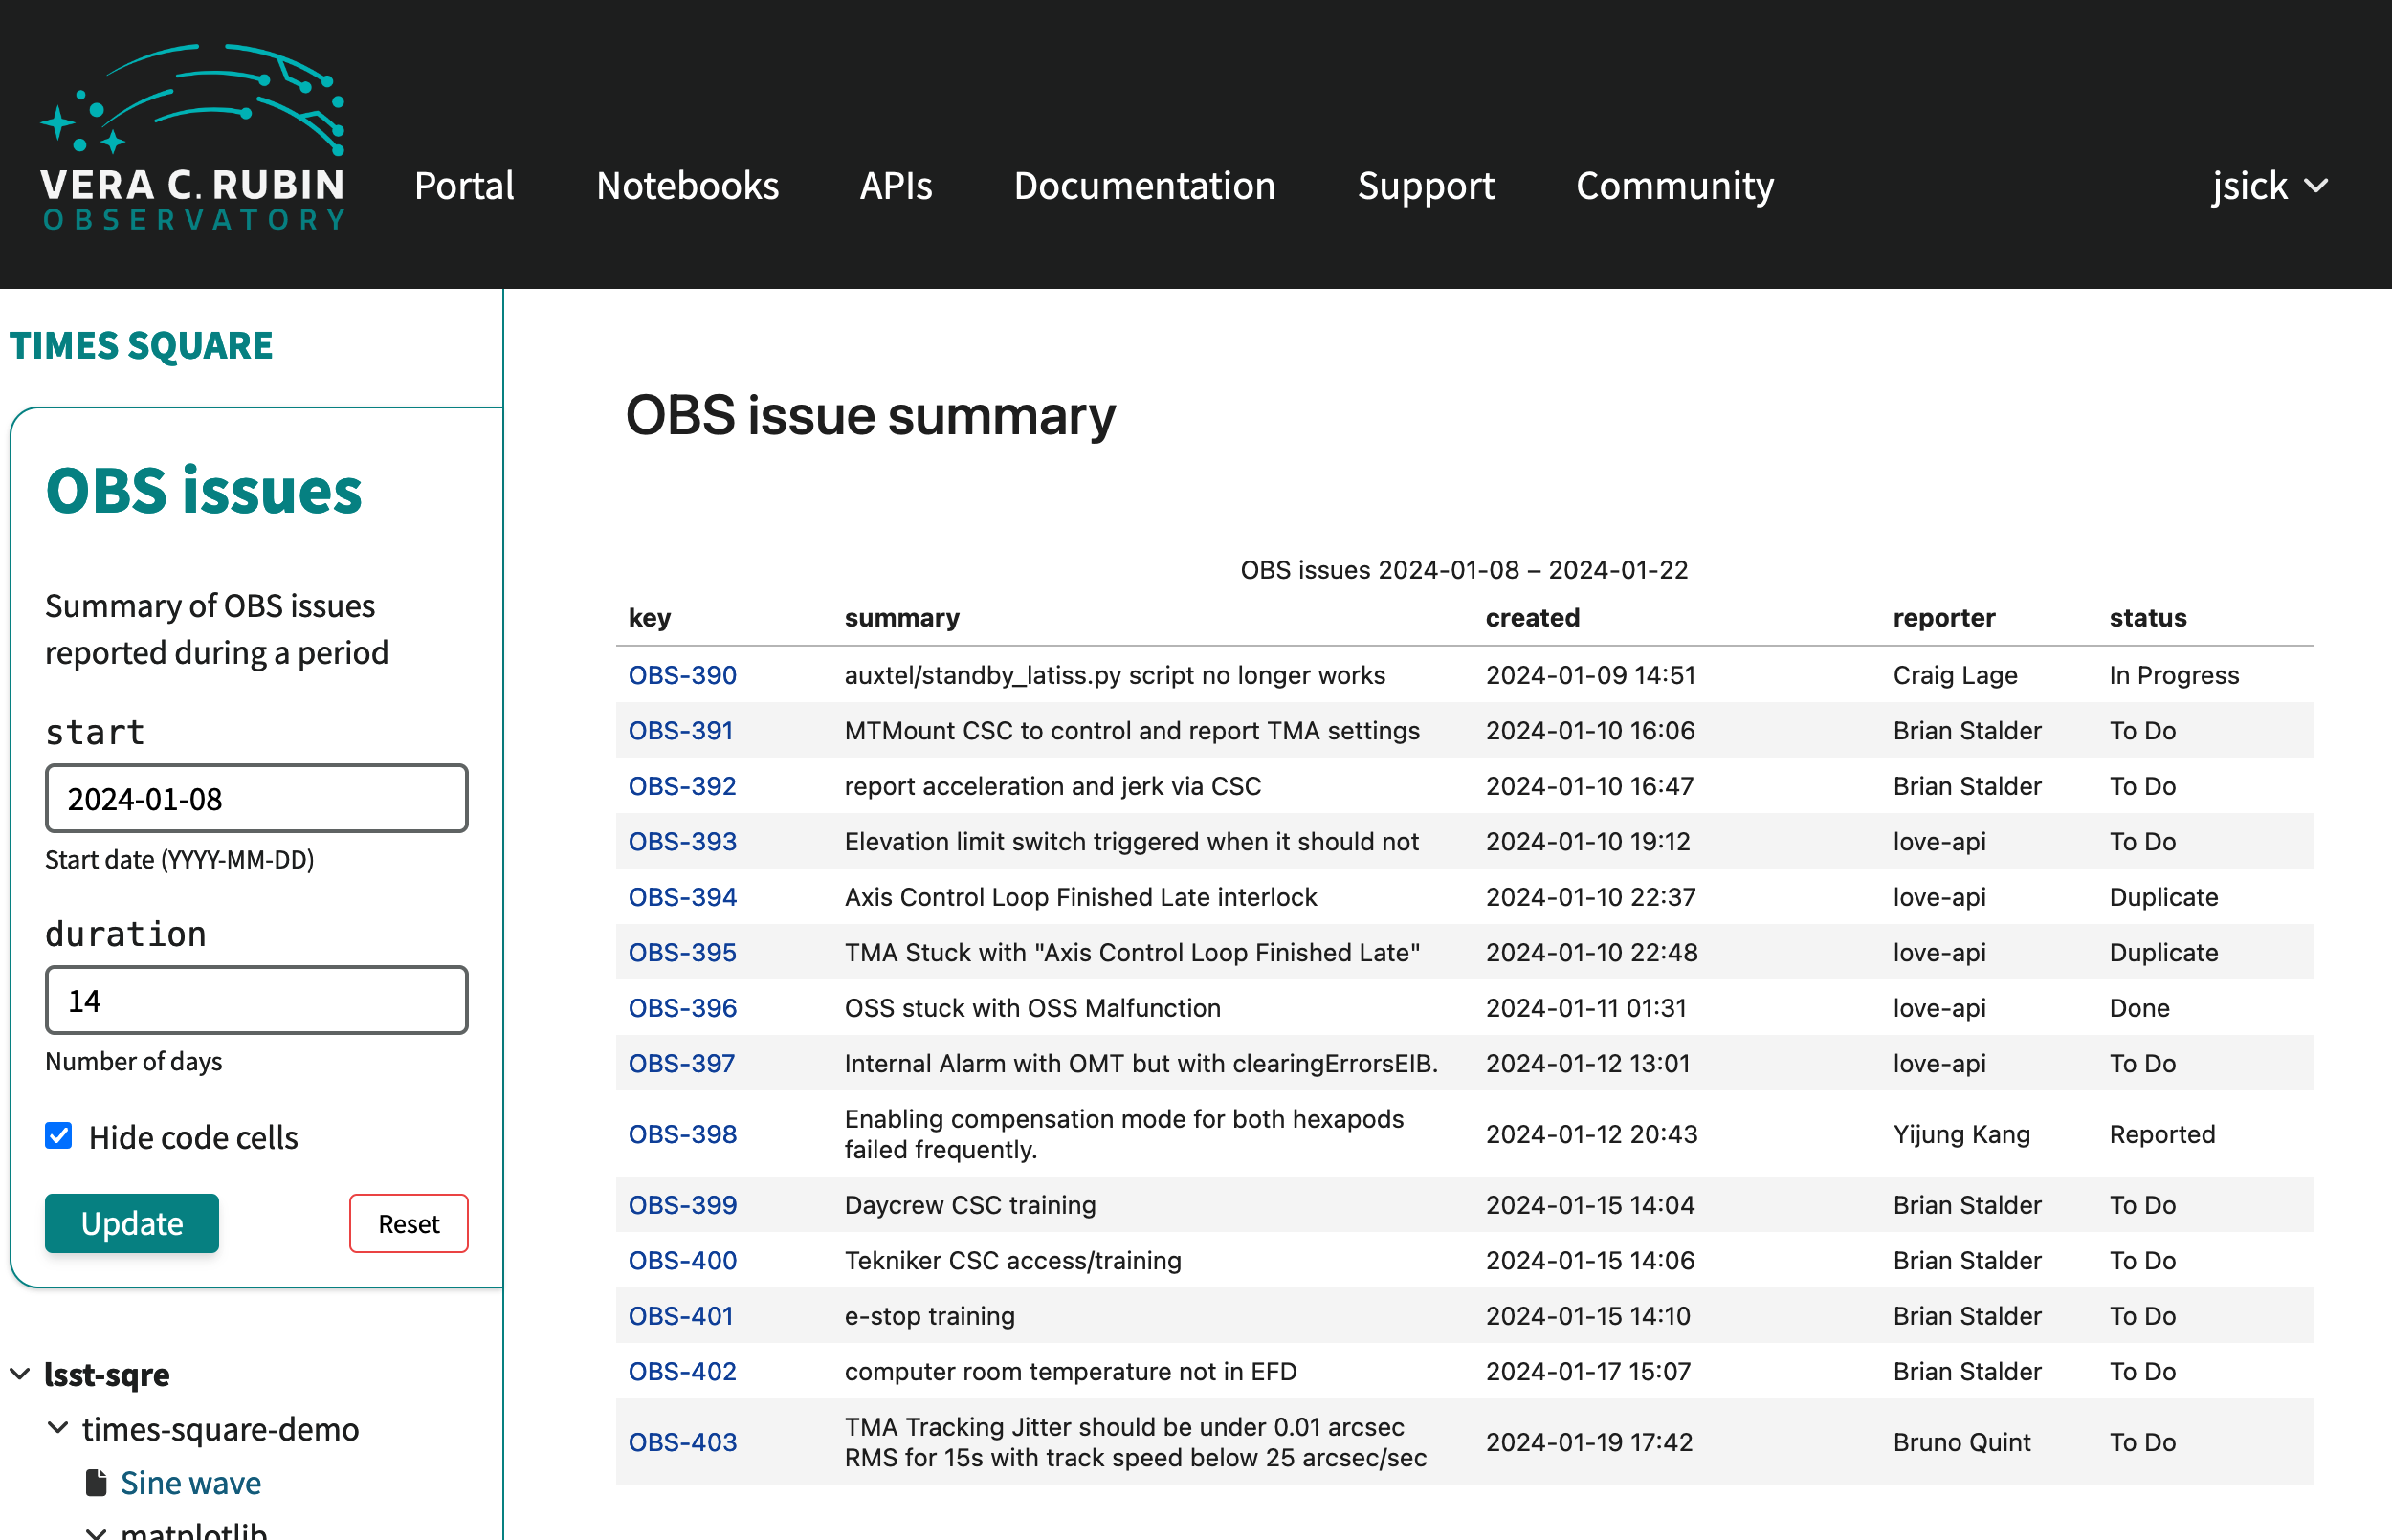
Fig. 1 Jira issue summary notebook demo.#
Weather data from the EFD#
Times Square notebooks can tap into EFD data to generates plots and statistics. As an example, the “Weather” notebook queries the EFD for weather and seeing data and to plot conditions over the course of a night.
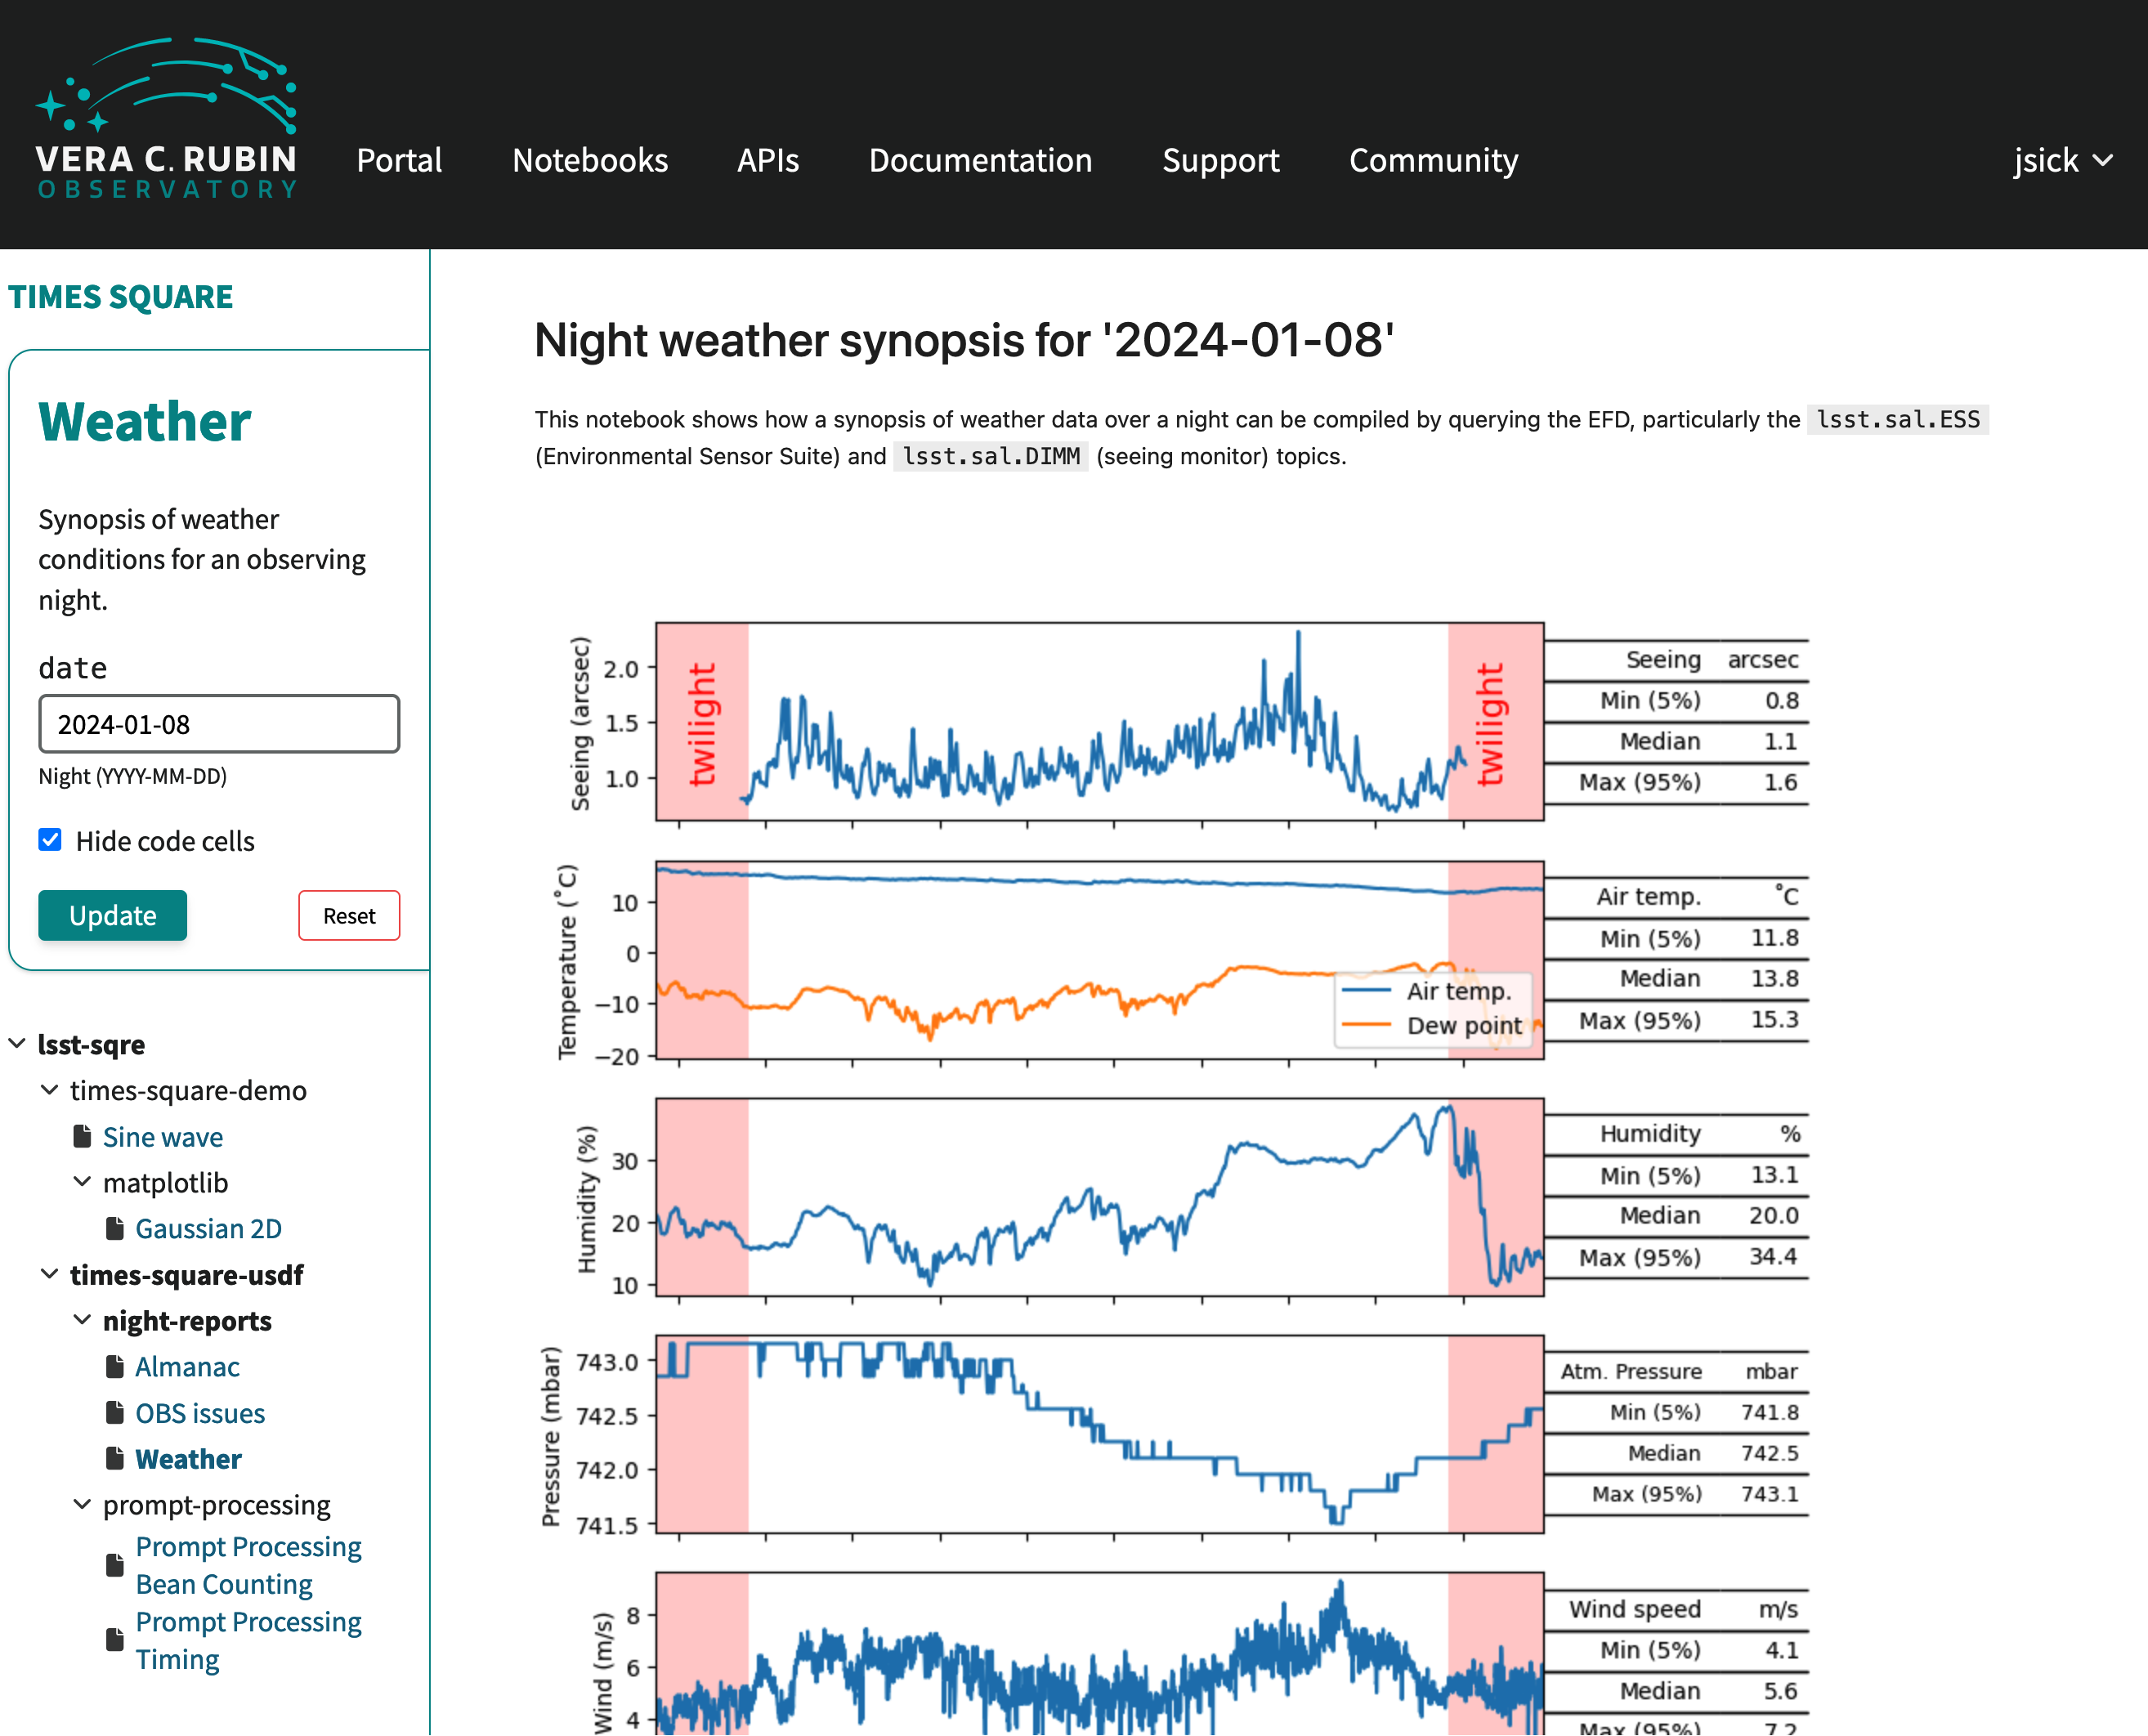
Fig. 2 Demo of plotting weather data from the EFD.#
Almanac#
Observing reports commonly include basic information about the timing of sun and moon rise and set, and well as moon phase. Since a notebook is Python, a Times Square night report can calculate these values. Values like the twilight periods can also be used throughout a notebook to annotate time series plots.
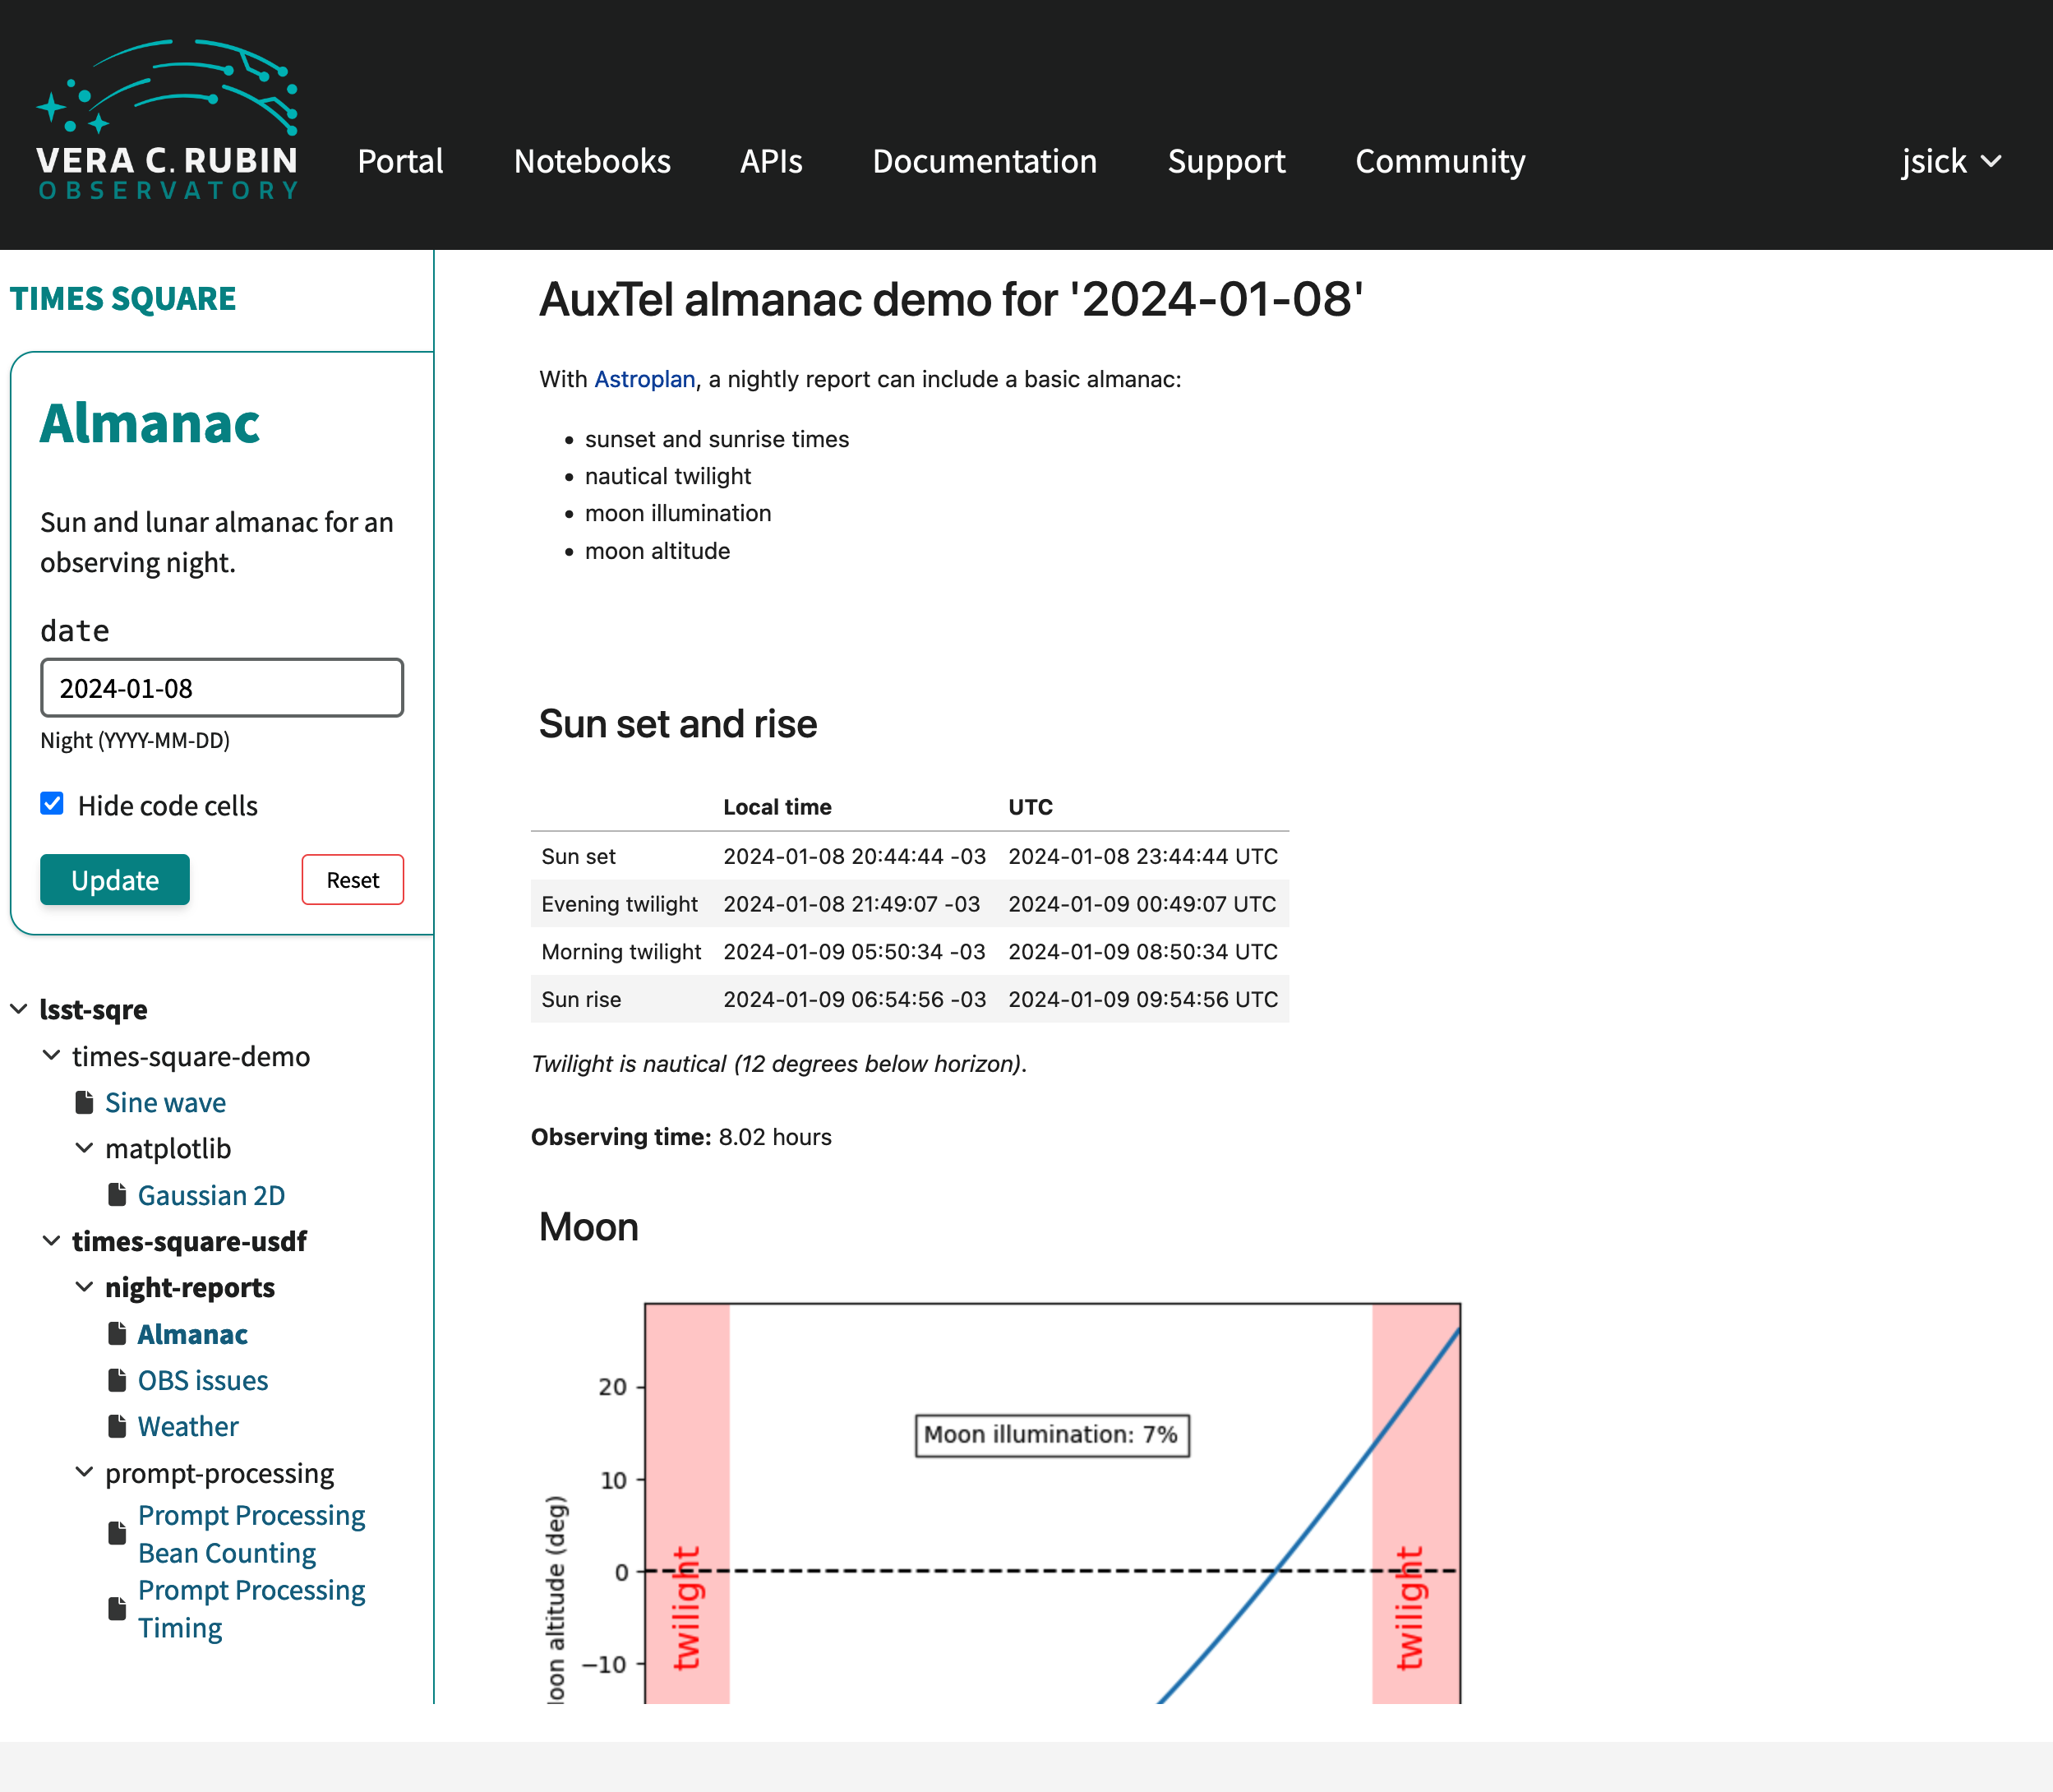
Fig. 3 Demo of almanac calculations.#